
We talk a lot about conversions, but conversion rate optimization (CRO) can be a little intimidating for beginners.
You might think your site works perfectly since it’s well designed, your message rings loud, clear, and gets straight to the point.
The problem is, however, all of these things are subjective, and when you’re not getting the conversions you were hoping for, it’s tempting to start changing your site.
Don’t do it.
Below, we’ll look at some easy ways to run conversion research to get a sense of what’s going on.
Start with the Technical Stuff
The first step should be a technical assessment of the site. Don’t even think about changing anything until you know exactly what’s up.
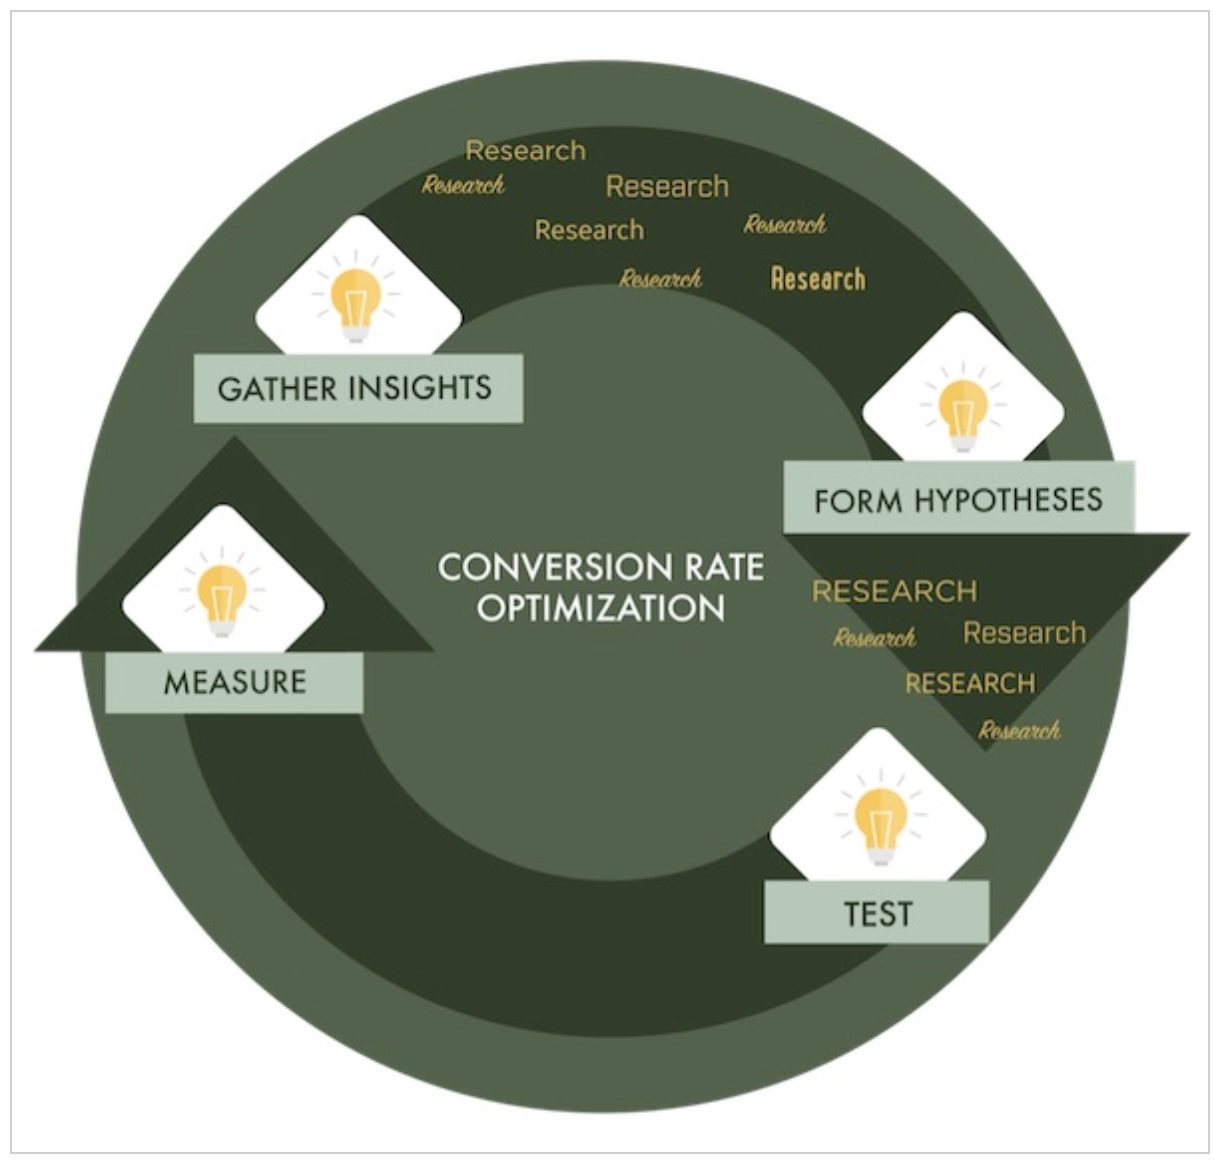
We’ve gone over testing methods in the past and the first stage of optimization is gathering insights. As a point of reference, this chart illustrates the CRO cycle from start to end. There, you can see that research informs the rest of the optimization strategy.
Below, we’ve listed a few places to start your research. While some might seem a bit obvious, it’s best to start with the easy, quantifiable stuff you can use to inform your hypotheses down the road.
Run a speed test
It’s a fact. Fast-loading sites mean higher conversion rates, better engagement, and sometimes, higher search engine rankings. On mobile, speed matters even more.
Ideally, your load time should be under three seconds, but keeping things under about seven should be fine. As a point of reference, the average e-commerce site takes just under five seconds to load useable content.
But, people have some high expectations. 57% of users abandon a site if it doesn’t load within three seconds. Check your site by heading over to Google PageSpeed Insights.
Check on Browser and Mobile Conversions
Again, this is another example of tackling low-hanging fruit straight off the bat. Log into your Google Analytics account and look at traffic by a browser.
Here, you’re looking at high-level trends, check to see if any certain browser or device is converting at a rate much higher or lower than the rest.
To access this report, go to the Audience tab, then Technology > Browser & OS.
You’ll also want to look at how mobile is performing. Access this information by going to Audience > Mobile > Devices. If mobile conversions are way lower than web conversions, your site might not be properly optimized.
Run a Content Inventory
A content inventory helps you look at each page with a systematic approach. What you’ll want to do is create a basic spreadsheet with the following columns:
- URL
- Title
- Headings
- Meta description
- Categories
- Tags
- Meta keywords
Check that websites have all of these elements in place and that they center around your business goals. The purpose of the inventory is to ensure your site is SEO-optimized, you’ll also be able to flag any poor quality content or irrelevant pages in the process.
Audit Your Forms, Buttons, and CTAs
Look at your landing pages. If you’re attracting a good amount of traffic, but not seeing the conversion numbers you’d like, take a look at your forms and landing pages.
Try filling them out yourself and recruit some colleagues or friends to do the same. Get rid of unnecessary form fields—asking yourself if each line is required to get them what they need.
Take Stock of Your Photos
Stock photos come in handy when it comes to adding visuals to your site on a budget. But, choosing the wrong ones or failing to customize them can turn customers off. Bad photo choices make you look like you don’t care—or worse, lack empathy or originality.
Bad photo choices make you look like you don’t care—or worse, lack empathy or originality. Click To TweetA VWO survey found that companies that added custom photos to their site saw 45% more conversions than those relying too heavily on stock photos.
Heuristics– Looking at the Softer Elements of UX
Once you’ve audited your site for any technical issues, the next step is to run an experience-based assessment.
Internally, you’ll want to look at each page of your site through a specific set of criteria:
- How does the page communicate value?
- Is the content relevant?
- Is the message clear?
- Are there points of friction?
- Does the page contain any distractions?
Now, here, not everything is cut and dry. Ideally, you should get multiple team members involved in this analysis—your marketers, writers, designers, salespeople, and so on.
Assess each page for the criteria mentioned above and stick to the items listed. Compile your findings in a Google Doc or another collaborative tool and discuss them at a later date.
These findings will serve as the starting point for setting up a content strategy or redesigning parts of your site.
Get Real Visitors Involved
Additionally, if you want to understand your visitors’ pain points, just ask them.
Tips for asking for relevant information:
- Don’t ask “Yes” or “No” questions: There’s no opportunity to dive deeper, which will not let you get to the bottom of why something isn’t quite right. At the very least, provide an option for “Other” accompanied by a line where they can state their answer.
- Ask open-ended questions: Keeping things open means that respondents have the freedom to share their actual thoughts. As such, the findings are more revealing than a predetermined set of answers.
- Make sure your survey is simple: Pose questions with simple language and don’t ask too many of them. Never ask more than one thing at a time. For example, “How would you rate our customer service and the quality of our products?” increases the likelihood the respondent will focus on one part of the question or skip it altogether.
- Survey questions should be markedly different from one another. Vary the type of questions you ask and space similar questions apart from one another. This provides some insurance against coming across as annoying to the user.
Beyond asking customers questions, you may also want to employ some other methods of uncovering potential problems.
A couple of options:
Heatmaps
Heatmaps offer a different set of information than merely asking consumers how they feel. It’s showing versus telling. Heatmaps come in various iterations.
For example, scroll maps help you understand what point a website user scrolls to and when they abandon the website.
The mouse movement maps show which buttons and links get the most attention. This type of heatmap shows site owners which parts of the site people are missing.
Click maps show which parts of the website people click on most often. Additionally, click maps can highlight distractions on the page or items that people think are clickable but aren’t.

Recorded Navigation
Visitor recording presents UX data in another way, by giving site owners the ability to see how users experience the website. You’ll see where people get stuck, areas they spend more time on, ignore, or breeze through quickly. You can opt to record visuals only or include audio—the benefit there is, you’ll see the navigation in action, and the user narrates their experience.
Set Up an End-to-End Funnel Analysis
So, how will you finally figure out whether or not your marketing efforts are successful?
Well, the answer is, you won’t know unless you’re analyzing your performance. Luckily, Google Analytics allows you to set up a funnel analysis—for free.
Again, the funnel refers to the process where a visitor moves from prospect to customer.
We should mention that setting goals alone aren’t the same as running a funnel analysis.
Goals are basic, standalone KPIs, where conversion optimization is a broader, strategic effort. The CRO process allows you to isolate problems at any point during the buyer’s journey and address them accordingly.
Still, funnel analysis starts with a goal. The chart below, while not the prettiest, represents a few different paths to track in your GA account.
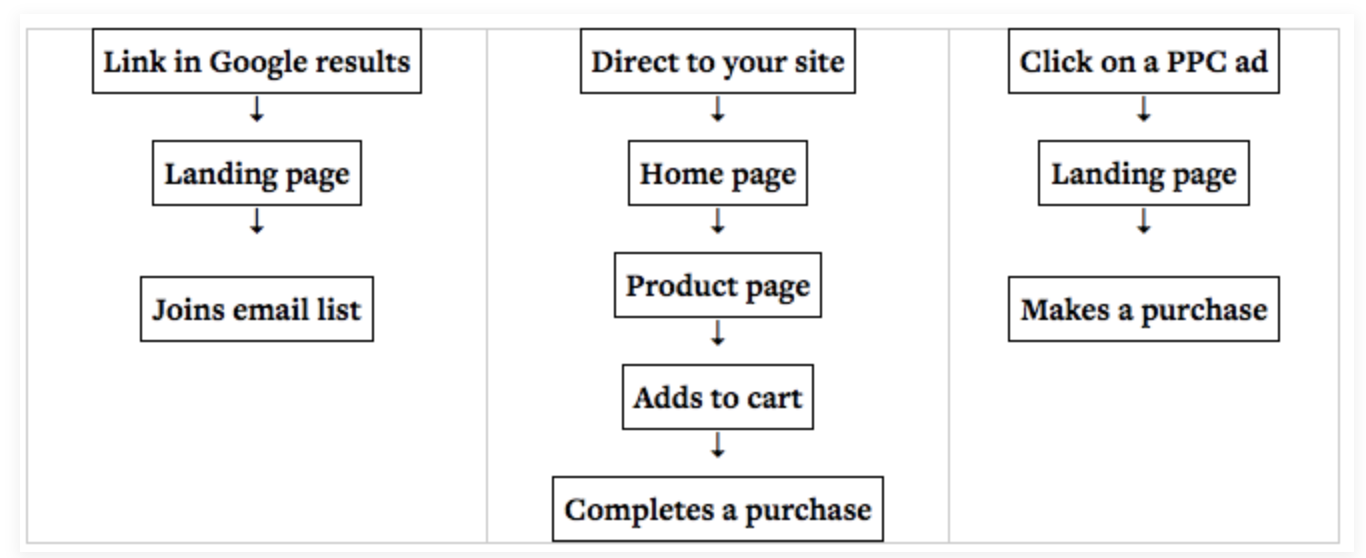
So, you can start by setting up a goal, like a form submission and define the conversion. You’ll set a value–in this case $0–and a destination that serves as the marker of success.
We’ll defer to Neil Patel here; this guide will walk you through the funnel setup process in detail.
Wrapping Up
You’ll revisit these research steps time and time again. As you can see in this handy chart below, the insights uncovered during this initial phase set the tone for predictions, testing, and ultimately, your marketing strategy.
Finally, it’s worth pointing out that practice makes perfect in the wild world of conversion research. Again, your strategy begins with identifying technical issues that could be getting in the way of conversions.
Then, you’ll want to move into the soft stuff—is your content resonating with users and do your photos and color choices make sense for your brand?
Finally, you’ll bring it all together by analyzing conversions within the funnel. And, then, you start the process again. Use your research to uncover new points of friction and come up with a hypothesis based on each potential issue.
That said—if this all feels like too much, we understand. Tall Cube employs a whole team of folks dedicated to using data to drive traffic, engage your audience, and of course, boost those conversions.
Contact us today to start your website transformation.